
Ask a manufacturer's sales team for the forecast and you get pipeline: open opportunities, weighted by stage, dated by close. Ask finance and you get shipments: open orders in the ERP, dated by when they leave the dock. Both numbers are right. Neither is the forecast, because next quarter's revenue comes from both, and almost nobody puts them in the same view.
Backlog Is Most of the Revenue You'll Recognize
In manufacturing, the order you close today often ships months from now. The U.S. Census Bureau's August 2026 full report on manufacturers' shipments, inventories and orders puts unfilled orders for durable goods at $1,609.6 billion, up in 25 of the last 26 months, with an unfilled orders-to-shipments ratio of 6.87. Put simply, the industry is sitting on several months of booked work at any given time.
That backlog is where most of next quarter's revenue comes from. A sales forecast that only counts new bookings tells leadership what reps expect to sign. It doesn't tell them what the business will ship and invoice, and that's the number the CFO is asked about.
Why the Two Numbers Never Meet
- Different dates. The CRM dates a deal by close. The ERP dates an order by scheduled ship. A deal that closes in March can be June revenue, and the forecast never shows the gap.
- Different systems. Pipeline lives in the CRM. Open orders, ship schedules and cancellations live in the ERP. The bridge is usually an ad-hoc spreadsheet someone rebuilds before the board meeting.
- Slippage nobody sees. When production pushes an order out a month, the ERP knows. Sales doesn't, and neither does the revenue forecast, until month-end close comes in short.
- Cancellations and change orders. Backlog isn't guaranteed revenue. Orders get cut, reduced and rescheduled, and if nobody tracks that rate, backlog gets treated as cash in hand.
Build One Forecast From Both
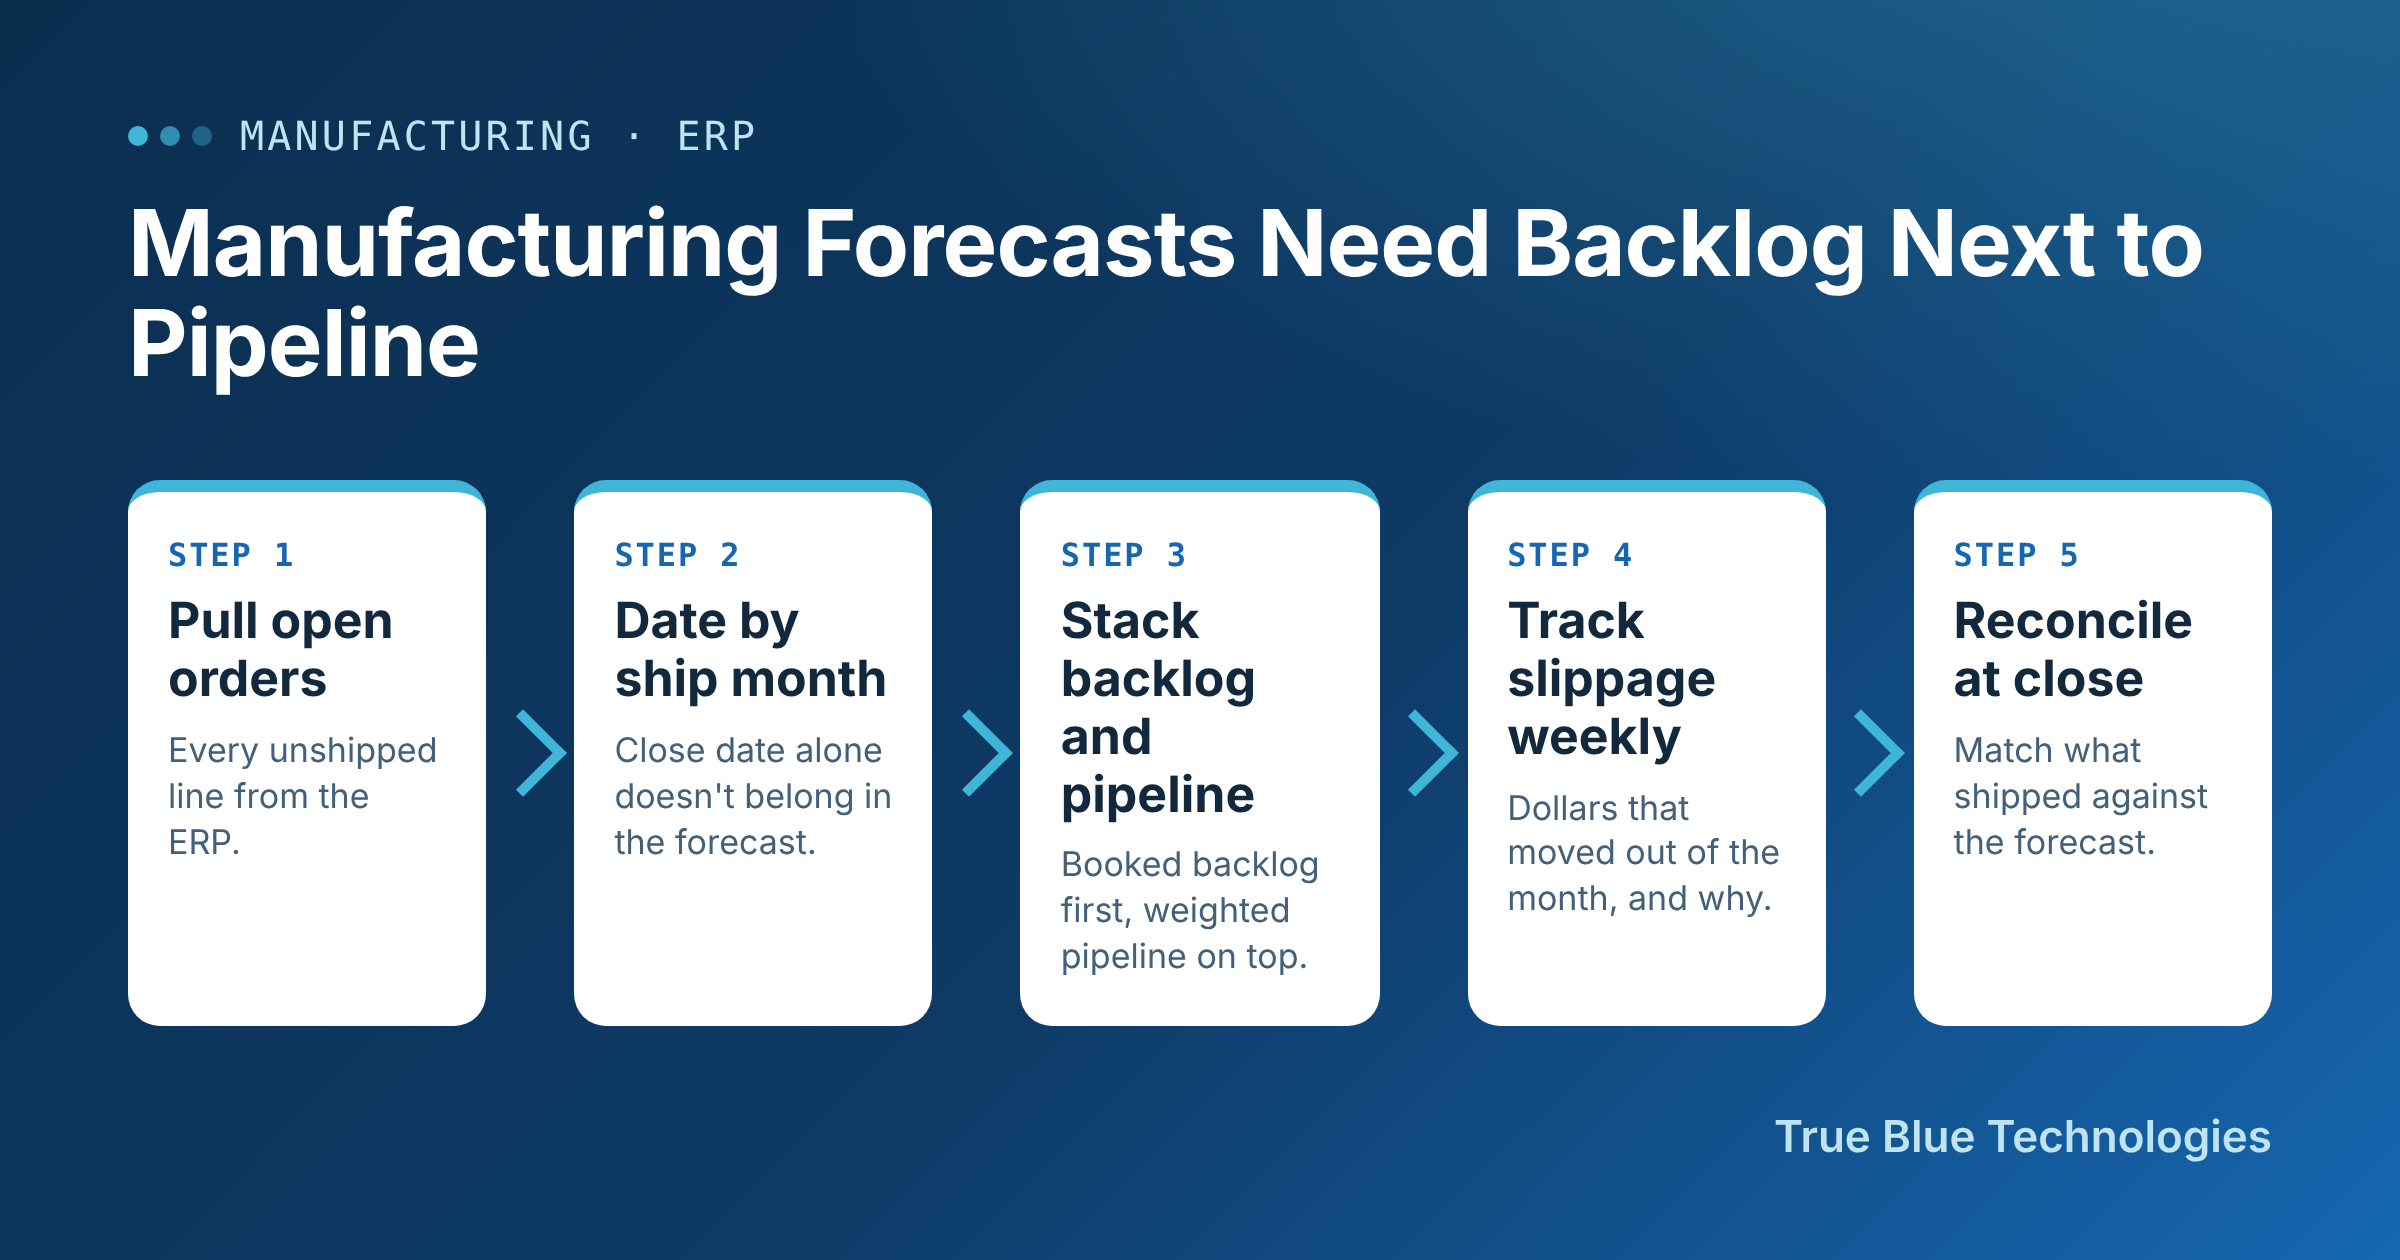
- Pull open orders from the ERP. Every unshipped line with its value, customer and current scheduled ship date. This is the booked layer, and the ERP is the source of truth for it.
- Date pipeline by expected ship month. Add an expected ship date to each opportunity, or derive it from close date plus the product line's standard lead time. Close date alone doesn't belong in a revenue forecast for a manufacturer.
- Stack backlog and weighted pipeline. For each future month, show booked backlog first and weighted pipeline on top. Leadership sees how much of the quarter is already booked and how much still depends on deals closing.
- Track slippage weekly. Compare each order's ship date to last week's. Report the dollars that moved out of the month and why, so sales and operations see the same push at the same time.
- Reconcile at month-end close. Match what shipped against what the forecast said would ship. The variance by cause, whether slipped orders, cancellations or deals that didn't close, tells you which layer to fix.
Where the Analytics Budget Should Go First
Manufacturers are spending on this. Deloitte's 2026 Manufacturing Industry Outlook reports that in a 2025 survey of 600 manufacturing executives, 80% plan to invest 20% or more of their improvement budgets in smart manufacturing initiatives, with data analytics among the foundational tools. Much of that money goes to the plant floor. A share of it should go to the view that connects the plant floor to the revenue number.
It doesn't take a new platform. Most of the teams we work with already have the data: open orders in the ERP and pipeline in the CRM. What's missing is a shared ship-month date and a scheduled sync, so the combined view refreshes on its own instead of in a spreadsheet the night before a review.
What to Measure
Track booked coverage, meaning the share of next quarter's revenue target already in backlog. Add backlog slippage in dollars per week, the cancellation rate on open orders, and forecast accuracy at month-end close for each layer separately. When coverage is high and slippage is low, the forecast is mostly arithmetic. When it isn't, you know exactly where to drill down.
Our Take
For a manufacturer, pipeline is only half the forecast, and usually the smaller half. Put ERP backlog and CRM pipeline in one view, dated the same way, and sales, operations and finance stop arguing about whose number is right. If you'd like help, we'll map your open orders and pipeline into a single ship-month forecast and show you where the two have been drifting apart.