Leveraging Tableau and Geospatial Mapping for Strategic Insights in Healthcare

In the dynamic world of healthcare, data-driven decision-making is essential for maintaining a competitive edge. One powerful tool healthcare companies can utilize is Tableau, a leading data visualization platform. Combined with geospatial mapping, such as plotting data on a map of the USA, Tableau enables healthcare companies to gain valuable insights into their current customers, prospects, and competitor accounts. This blog post will explore how healthcare companies can harness Tableau and geospatial mapping to drive strategic growth and operational efficiency.

The Power of Tableau in Healthcare

Tableau is a powerful business intelligence tool that allows users to create interactive and shareable dashboards. With its intuitive drag-and-drop interface, Tableau makes it easy for healthcare companies to visualize complex data sets, uncover hidden patterns, and make informed decisions.

Why Geospatial Mapping?

Geospatial mapping involves plotting data on maps to visualize relationships and trends based on location. For healthcare companies, geospatial mapping can reveal critical insights, such as regional service demand, market penetration, and competitive landscape. By combining Tableau with geospatial mapping, healthcare companies can comprehensively represent their market presence.

Plotting Current Customers, Prospects, and Competitors

To effectively leverage Tableau and a map of the USA, healthcare companies can follow these steps to plot their current customers, prospects, and competitor accounts:

1  Data Collection and Preparation

The first step is to gather data on current customers, prospects, and competitors. This data should include relevant information such as:

– Customer and prospect addresses
– Competitor locations
– Demographic data
– Sales and revenue data

Once collected, this data must be cleaned and formatted to ensure accuracy and consistency. Ensure all addresses are standardized and geocoded to obtain precise latitude and longitude coordinates.

2. Importing Data into Tableau

After preparing the data, import it into Tableau. Tableau supports various data sources, including Excel, SQL databases, and cloud services. Connect to your data source and load the relevant datasets into Tableau.

3. Creating the Map Visualization

With the data loaded, you can now create a map visualization in Tableau:

– Open Tableau Desktop: Start a new workbook and select the appropriate data source.
– Add a Map: Drag the latitude and longitude fields onto the Rows and Columns shelves, respectively. Tableau will automatically generate a map.
– Plot Data Points: Drag customer, prospect, and competitor data onto the map. Use different symbols or colors to distinguish between these groups.
– Add Layers and Filters: Enhance the map by adding layers for additional context, such as demographic information or market potential. Use filters to refine the data displayed on the map.

4. Analyzing the Map

With the map visualization complete, healthcare companies can perform various analyses:

Market Penetration: Identify regions with high concentrations of current customers versus areas with many prospects. This can highlight opportunities for targeted marketing and sales efforts.
Competitive Landscape: Analyze competitors’ proximity to current customers and prospects. This can help identify regions where competitive pressure is high and inform strategic decisions about resource allocation.
Sales Performance: Correlate sales and revenue data with geographic locations to identify high-performing regions and areas needing improvement.

5. Sharing and Collaboration

Tableau allows for easy sharing and collaboration. Healthcare companies can publish their map visualizations to Tableau Server or Tableau Online, making them accessible to stakeholders across the organization. Interactive dashboards enable users to explore the data, apply filters, and gain insights tailored to their needs.

Conclusion

Healthcare companies can comprehensively understand their market landscape by leveraging Tableau and geospatial mapping. Plotting current customers, prospects, and competitor accounts on a map of the USA provides valuable insights that drive strategic growth and operational efficiency. With the power of data visualization, healthcare companies can stay ahead of the competition and deliver better outcomes for their patients and stakeholders.

Why Manufacturers Choose Zoho One

True Blue can help you with comprehensive Zoho support, ensuring seamless integration, customization, and efficient use of the Zoho suite.

Manufacturers choose Zoho One for several reasons:

1. Comprehensive Suite: Zoho One offers an all-in-one suite of over 45 integrated applications that cater to various business needs, from CRM and project management to finance and HR, providing a seamless experience.

2. Cost-Effective: It provides a cost-effective solution with a single subscription model, eliminating the need for multiple software licenses and reducing overall expenses.

3. Customization and Flexibility: Zoho One is highly customizable, allowing manufacturers to tailor the applications to their business processes and workflows.

4. Integration Capabilities: It offers strong integration capabilities, enabling manufacturers to connect Zoho apps with third-party tools and streamline operations.

5. Scalability: Zoho One scales with the business, making it suitable for small manufacturers and larger enterprises as they grow.

6. Automation: The platform includes robust features that help manufacturers automate repetitive tasks, improve efficiency, and reduce manual errors.

7. Data Analytics: With powerful analytics and reporting tools, Zoho One helps manufacturers gain insights into their operations, sales, and marketing efforts, facilitating data-driven decision-making.

8. Customer Support: Zoho provides customer support, helping manufacturers effectively implement and utilize the software suite.

9. Cloud-Based: Zoho One is cloud-based, ensuring that manufacturers can access their data and applications from anywhere, supporting remote work and global operations.

Boost Your Field Sales and Service Efficiency with Zoho CRM and Mapsly Integration

Optimizing field sales and service operations is essential for maintaining an edge in today’s highly competitive business landscape. Two powerful tools that can significantly enhance your business are Zoho CRM and Mapsly. Individually, they offer substantial benefits, but combined, they can transform how you manage field sales and service operations.

What is Zoho CRM?

Zoho CRM is a robust customer relationship management platform designed to streamline your sales, marketing, and support functions in a single system. It helps businesses of all sizes manage their customer interactions, sales pipelines, and marketing campaigns efficiently. Key features include:

  • Lead Management: Track and manage potential leads from various sources.
  • Contact Management: Maintain comprehensive contact profiles with detailed information.
  • Sales Automation: Automate repetitive tasks to focus on closing deals.
  • Analytics and Reporting: Gain insights into your sales performance with detailed reports.
  • Integrations: Seamlessly integrate with other Zoho applications and third-party tools.

Zoho CRM is known for its flexibility, allowing businesses to customize the platform to fit their specific needs.

What is Mapsly?

Mapsly is a powerful geo-mapping and location intelligence tool that integrates with various CRMs, including Zoho CRM. It enables businesses to visualize, analyze, and optimize their field operations using geographical data. Key features of Mapsly include:

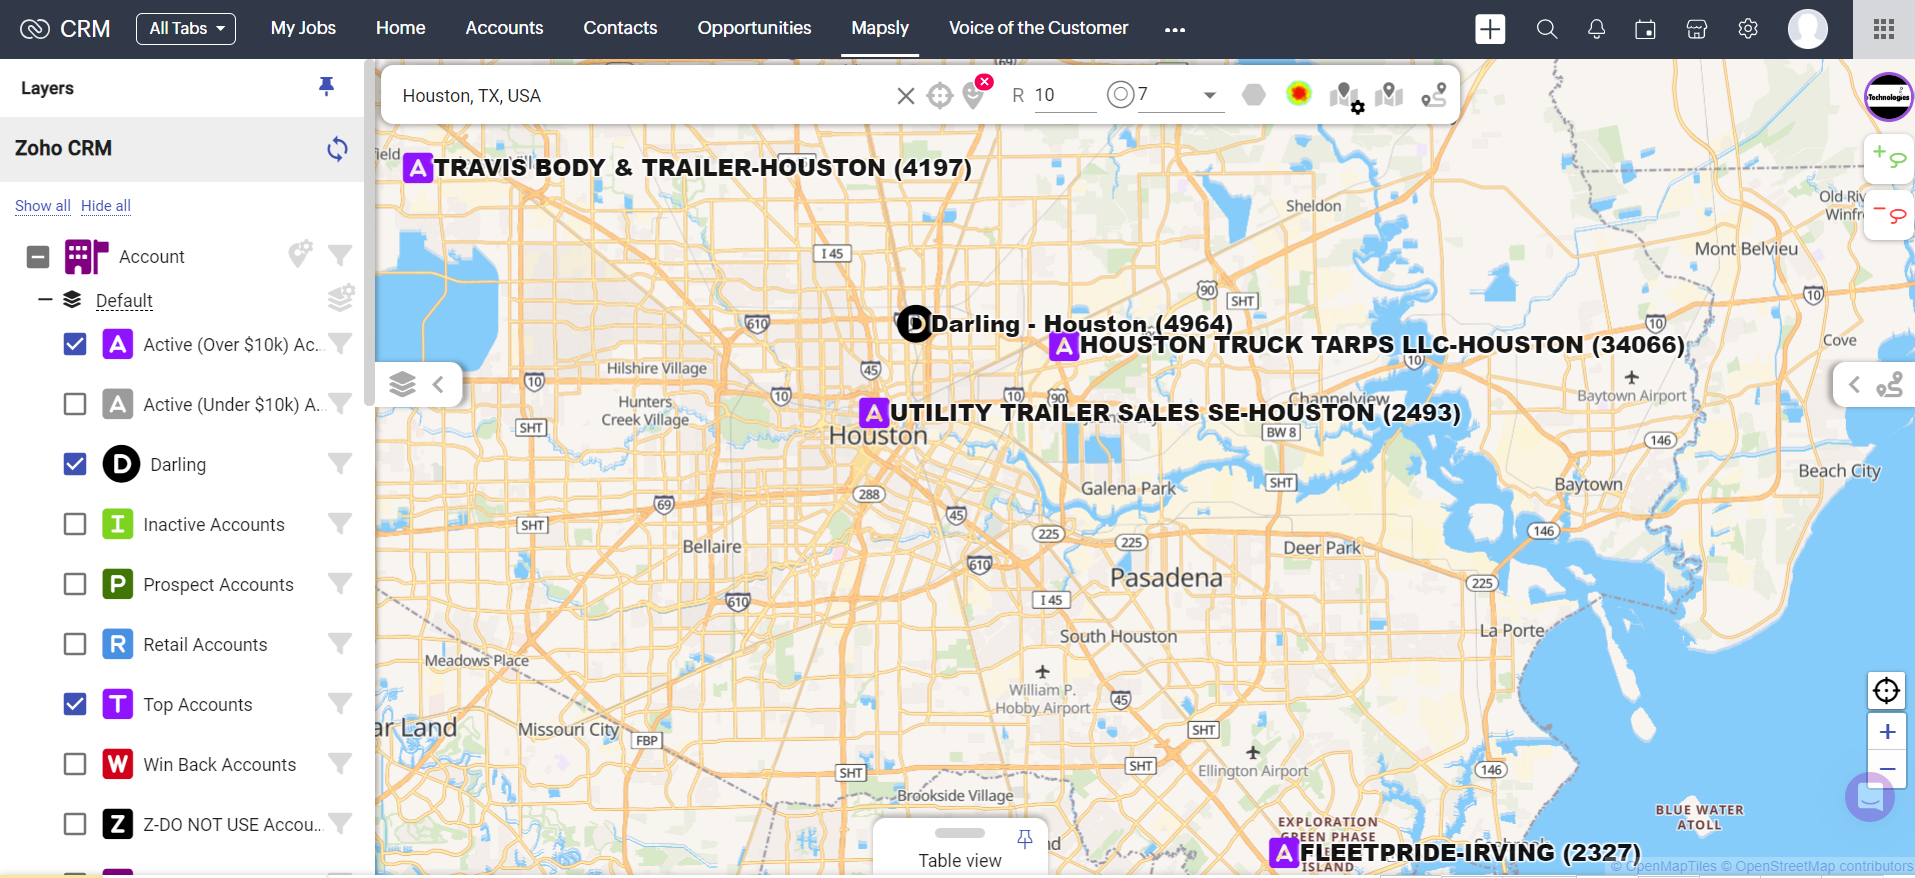
  • Interactive Maps: Visualize your data on interactive maps for better understanding and decision-making.
  • Route Optimization: Plan and optimize routes for field sales and service teams to increase efficiency.
  • Territory Management: Define and manage sales territories to balance workload and maximize coverage.
  • Geographical Insights: Gain insights into customer distribution and regional performance.
  • Real-Time Tracking: Monitor the real-time location of field teams to improve coordination.

The Power of Integration

Integrating Zoho CRM with Mapsly unlocks a plethora of benefits, allowing businesses to harness the full potential of their CRM data in a geographical context. Here’s how this integration can elevate your field sales and service operations:

  1. Enhanced Customer Insights: By visualizing your CRM data on a map, you can gain a deeper understanding of your customer base. Identify regional trends, spot new opportunities, and make data-driven decisions.

  2. Optimized Field Operations: With Mapsly’s route optimization feature, your field teams can plan their visits more efficiently. This reduces travel time, lowers costs, and ensures timely customer interactions.

  3. Balanced Sales Territories: Effective territory management helps you allocate resources more effectively. Ensure that your sales teams have balanced workloads and that no potential customer is left unattended.

  4. Improved Coordination: Real-time tracking of field teams allows for better coordination and responsiveness. Quickly reassign tasks based on team locations and current workload.

  5. Data-Driven Decision Making: Combining CRM data with geographical insights provides a holistic view of your business performance. Use this information to strategize and implement targeted marketing campaigns.

Conclusion

Integrating Zoho CRM with Mapsly offers a powerful combination for businesses looking to enhance their field sales and service operations. By leveraging the strengths of both tools, you can gain deeper insights, optimize field operations, and make informed decisions that drive growth.

Embrace the synergy of Zoho CRM and Mapsly to stay ahead in the competitive business landscape and maximize your business potential.

Zoho Flow: Streamlining Your Business Workflows

In today’s fast-paced business environment, efficiency and automation are crucial for staying competitive. One tool that is available in the realm of business automation is Zoho Flow. But what exactly is Zoho Flow, and how can it benefit your business? Let’s dive in and explore how this powerful tool can help you streamline your workflows and boost productivity.

What is Zoho Flow?

Zoho Flow is an integration and automation platform designed to connect your apps and automate workflows. With Zoho Flow, you can create complex workflows that span across multiple applications, without writing a single line of code. It’s part of the Zoho suite of products, known for its robust and user-friendly business solutions.

Key Features of Zoho Flow

1. Visual Builder: Zoho Flow features a drag-and-drop visual builder that makes it easy to create workflows. You don’t need any coding skills; just connect your apps and define the triggers and actions.

2. Wide Range of Integrations: Zoho Flow supports over 500 applications, including popular ones like Google Workspace, Slack, Trello, and many others. This extensive integration capability ensures that you can connect virtually any app you use in your business operations.

3. Pre-Built Templates: For those who want to get started quickly, Zoho Flow offers a variety of pre-built templates. These templates cover common business scenarios, saving you time and effort in setting up workflows from scratch.

4. Custom Functions: While Zoho Flow is designed for simplicity, it doesn’t compromise on flexibility. You can create custom functions using Deluge, Zoho’s scripting language, to handle more complex tasks.

5. Real-Time Collaboration: Zoho Flow allows teams to collaborate on workflows in real-time. Multiple team members can work together, making it easier to design, test, and deploy workflows.

6. Comprehensive Analytics: Understanding how your workflows perform is crucial. Zoho Flow provides detailed analytics and logs to help you monitor and optimize your automation processes.

Benefits of Using Zoho Flow

1. Increased Efficiency: By automating repetitive tasks, Zoho Flow frees up your time to focus on more strategic activities. This leads to significant improvements in productivity and efficiency.

2. Error Reduction: Manual processes are prone to errors. Automation ensures that tasks are performed consistently and accurately, reducing the risk of mistakes.

3. Cost Savings: Automating workflows can lead to substantial cost savings. With Zoho Flow, you can reduce the need for manual labor and minimize the costs associated with errors and inefficiencies.

4. Scalability: As your business grows, your workflows can become more complex. Zoho Flow scales with your business, allowing you to handle increased volumes of tasks and integrations without a hitch.

5. Improved Collaboration: Zoho Flow fosters better collaboration among team members. Real-time updates and shared workflows ensure that everyone is on the same page, leading to smoother operations.

Use Cases for Zoho Flow

1. Sales Automation: Automatically add new leads from your website to your CRM, send welcome emails, and notify your sales team for follow-ups.

2. Customer Support: Integrate your support ticketing system with your project management tool to automatically create tasks for support tickets, ensuring timely resolutions.

3. Marketing Campaigns: Sync your email marketing platform with your CRM to update contact lists based on user interactions, ensuring targeted and effective campaigns.

4. Human Resources: Streamline your hiring process by connecting your job posting platform with your HR management system, automatically moving candidate information through the hiring pipeline.

Conclusion

Zoho Flow is a powerful tool that can transform the way you manage your business processes. By automating workflows and integrating your apps, you can achieve higher efficiency, reduce errors, and save costs. Whether you’re a small business or a large enterprise, Zoho Flow offers the flexibility and scalability to meet your needs. So why wait? Dive into the world of automation with Zoho Flow and take your business operations to the next level.

Streamlining Customer Complaints with a Custom Module in Zoho CRM

In the realm of customer service, handling complaints effectively is crucial. How a business manages complaints can significantly impact its reputation and customer loyalty. With Zoho CRM, creating a custom module specifically for customer complaints can provide numerous advantages, transforming a challenging aspect of customer service into an opportunity for growth and improvement. Let’s explore why this approach is beneficial and how it can enhance your business operations.

Why Use a Custom Module for Customer Complaints?

Centralized Complaint Management

Managing customer complaints across multiple channels and systems can be chaotic and inefficient. A custom module in Zoho CRM centralizes all complaint-related information, providing a single point of reference. This centralization ensures that every complaint is documented, tracked, and addressed systematically, reducing the risk of overlooked issues.

Streamlined Workflow Automation

A custom module allows you to automate various aspects of the complaint resolution process. From automatic assignment of complaints to relevant team members to sending timely follow-up reminders, automation ensures that each complaint is handled promptly and efficiently. This not only speeds up resolution times but also reduces the administrative burden on your staff.

Enhanced Data Analysis and Reporting

With all complaint data stored in one place, businesses can leverage Zoho CRM’s powerful analytics and reporting tools to gain insights into common issues and trends. Understanding the root causes of complaints allows you to make informed decisions about product improvements and service enhancements, ultimately reducing the number of complaints over time.

Improved Customer Satisfaction

Prompt and effective resolution of complaints is a key driver of customer satisfaction. By using a custom module in Zoho CRM, businesses can ensure a structured approach to handling complaints, leading to quicker resolutions and happier customers. Satisfied customers are more likely to remain loyal and recommend your business to others.

Benefits of Using a Custom Module for Customer Complaints

Increased Efficiency and Productivity

Automating complaint management processes through a custom module in Zoho CRM increases overall efficiency. Staff can focus on resolving issues rather than managing paperwork and manual follow-ups. This boost in productivity allows your team to handle a higher volume of complaints without compromising on the quality of service.

Greater Accountability and Transparency

A custom module provides a clear record of each complaint’s lifecycle, from initial logging to final resolution. This transparency ensures that all team members are accountable for their roles in the process. It also provides a comprehensive audit trail, which can be invaluable for identifying process improvements and training opportunities.

Enhanced Customer Relationships

Effectively managing customer complaints demonstrates to your customers that you value their feedback and are committed to addressing their concerns. This proactive approach helps build trust and strengthens customer relationships. Over time, this can lead to increased customer loyalty and positive word-of-mouth referrals.

Customization to Fit Your Business Needs

Every business is unique, and a one-size-fits-all solution often falls short. A custom module in Zoho CRM can be tailored to fit your specific needs, capturing the exact information that is relevant to your business. This flexibility ensures that the complaint management process aligns with your organizational goals and operational workflows.

Integration with Other Business Systems

Zoho CRM can seamlessly integrate with other business systems, such as email, helpdesk software, and analytics tools. This integration ensures that all relevant information is available in one place, facilitating a more holistic approach to complaint management. It also enables cross-functional teams to collaborate more effectively on resolving complex issues.

Conclusion

Implementing a custom module for customer complaints in Zoho CRM offers a myriad of benefits that can significantly enhance your business operations. From centralizing complaint management and automating workflows to providing valuable data insights and improving customer satisfaction, the advantages are clear. Investing in a robust, customizable complaint management system not only addresses current challenges but also positions your business for long-term success. By turning complaints into opportunities for improvement, you can foster stronger customer relationships and drive sustainable growth.

Tableau Tip: Extract vs Live Connection

In Tableau, the choice between using an extract and a live connection depends on various factors such as data size, performance requirements, and data freshness needs. Here are the key differences between using an extract and a live connection:

Extract Connection

Definition: An extract is a snapshot of data that Tableau pulls from the source and stores in a highly optimized, compressed format.

Advantages:

  1. Performance: Extracts generally offer better performance because the data is pre-aggregated and optimized for fast querying.
  2. Offline Access: Since the data is stored locally, you can work offline without needing a continuous connection to the data source.
  3. Speed: Extracts can speed up dashboards and visualizations, especially when working with large datasets.
  4. Customization: You can create filters and calculated fields in the extract, reducing the need to process these on the fly during analysis.

Disadvantages:

  1. Data Freshness: Extracts need to be refreshed to capture the latest data from the source, which might not be suitable for scenarios requiring real-time data.
  2. Storage: Extracts require local storage space, which can be a limitation if dealing with very large datasets.

Live Connection

Definition: A live connection directly connects to the data source and queries the data in real-time.

Advantages:

  1. Real-Time Data: Provides access to the most current data, making it ideal for scenarios where data freshness is crucial.
  2. No Local Storage Needed: Since data is not stored locally, there’s no need to worry about storage limitations.
  3. Simplicity: There’s no need to manage extract refresh schedules or handle extract files.

Disadvantages:

  1. Performance: Performance can be slower compared to extracts, especially if the data source is large or the queries are complex.
  2. Dependency on Source Availability: Requires a stable and fast connection to the data source. If the source is down or slow, it affects Tableau’s performance.
  3. Resource Intensive: Puts more load on the data source, which could impact its performance if multiple users are querying it simultaneously.

Choosing Between Extract and Live Connection

Use Extract when:

– You need better performance for large datasets.
– You want to work offline or have limited or unreliable connectivity to the data source.
– You don’t need real-time data and can work with scheduled refreshes.

Use Live Connection when:

– Real-time or near real-time data is critical for your analysis.
– You have a robust and reliable connection to the data source.
– The data volume is manageable, and the data source can handle real-time queries efficiently.

By considering these factors, you can decide the most appropriate connection type for your Tableau project.

Optimize Tableau Dashboards for Performance

Tableau dashboard example on manufacturing supply chainLet’s delve deeper into strategies that can help you build more efficient Tableau visualizations, especially when working with large datasets or complex analytics. Here are some specific tactics and considerations for improving the performance of your Tableau dashboards:

  1. Simplify Complex Calculations
    Complex calculations can significantly slow down your dashboard. Whenever possible, try to simplify these calculations or move them to the data preparation stage outside of Tableau. If you are using SQL databases, consider performing calculations at the database level through queries, which can reduce the load on Tableau and speed up the visualizations.
  2. Reduce the Number of Filters
    Each filter in Tableau can add additional queries that must be processed every time your data refreshes or your viewer interacts with the dashboard. Minimize the number of filters to the essential ones, and consider using context filters to prioritize important filters. Context filters limit the data that other filters must process, which can significantly improve performance.
  3. Limit Data at the Source
    Instead of importing the entire dataset into Tableau, limit the data to what’s necessary before it enters your dashboard. This can be done by using data source filters or by customizing your data import queries. Limiting data reduces the amount of information Tableau needs to process and store, which can enhance responsiveness and load times.
  4. Use Extracts Instead of Live Connections
    When dealing with large datasets, consider using Tableau data extracts instead of live data connections. Extracts are snapshots of data optimized for aggregation and loaded into system memory, which can be faster to query than continuously querying a live database. You can also schedule extracts to refresh during off-hours to ensure your dashboard has up-to-date data without compromising performance during peak usage times.
  5. Aggregate Data Where Possible
    Aggregating data at a higher level of detail can drastically improve performance. For example, if daily data granularity is not necessary, you can aggregate data at the weekly or monthly level. This reduces the volume of data Tableau has to process and can make your visualizations quicker to load and interact with.
  6. Use the Performance Recorder
    Tableau provides a built-in tool called the Performance Recorder, which helps in diagnosing performance issues. It tracks and records various events such as query execution, layout computations, and rendering times. Analyzing the results can help you pinpoint specific elements or actions that are slowing down your dashboard.
  7. Optimize Workbook Size
    Avoid unnecessary complexity in your workbook. This includes minimizing the number of sheets and dashboards. Each additional element increases the load time and can affect performance. Be strategic about what you include in your dashboard to ensure it’s both efficient and effective.

By implementing these strategies, you can significantly enhance the performance of your Tableau dashboards, ensuring they remain user-friendly and responsive even as datasets grow or analytics become more complex. This not only improves the user experience but also enables faster decision-making based on the insights generated from your data visualizations.

Inventory Management Technologies

Technology can significantly enhance inventory management in manufacturing through various ways. Here are some of the key technologies and how they help:

1. Enterprise Resource Planning (ERP) Systems: ERP systems integrate all facets of an enterprise into a single database, allowing for better inventory tracking, demand forecasting, and resource allocation. These systems enable manufacturers to maintain optimal inventory levels by predicting future demands based on historical data.

2. Internet of Things (IoT): IoT devices can be used to monitor inventory in real-time. Sensors and RFID tags help track the location and condition of goods throughout the manufacturing process and in storage. This technology provides instant data, helping to reduce overstocking or stockouts.

3. Automated Storage and Retrieval Systems (ASRS): These systems automate the placement and retrieval of items in a warehouse, improving the speed and efficiency of inventory management. They can significantly reduce human error and labor costs while increasing productivity.

4. Inventory Management Software: This software offers tools for tracking inventory levels, orders, sales, and deliveries. It can also be used to create work orders and bills of materials. Advanced software integrates with forecasting tools to adjust inventory levels based on predicted demand.

5. Artificial Intelligence (AI) and Machine Learning (ML): AI and ML can analyze vast amounts of data to predict trends, anticipate supply chain disruptions, and suggest optimal inventory levels. These technologies can also optimize picking routes and layouts for warehouses.

6. Blockchain: Blockchain can improve transparency in the supply chain. It provides a secure, unchangeable ledger, allowing manufacturers to track materials and products from the supplier to the end user, ensuring the authenticity of goods and compliance with regulations.

7. 3D Printing: On-demand manufacturing with 3D printing reduces the need for keeping large inventories of some parts. It allows manufacturers to produce parts as needed, which can be especially useful for custom and low-volume items.

By incorporating these technologies, manufacturers can streamline their inventory processes, reduce costs, improve accuracy, and enhance overall supply chain efficiency.